Monitoring
A quick reference guide to the system monitoring and diagnostic tools available in SAGE.
System Sensors
SAGE integrates with the native 'Sensors for External Monitoring' feature provided by Stibo STEP. This tool offers a real-time snapshot of the operational status of various system components such as background processes, integration endpoints, etc.
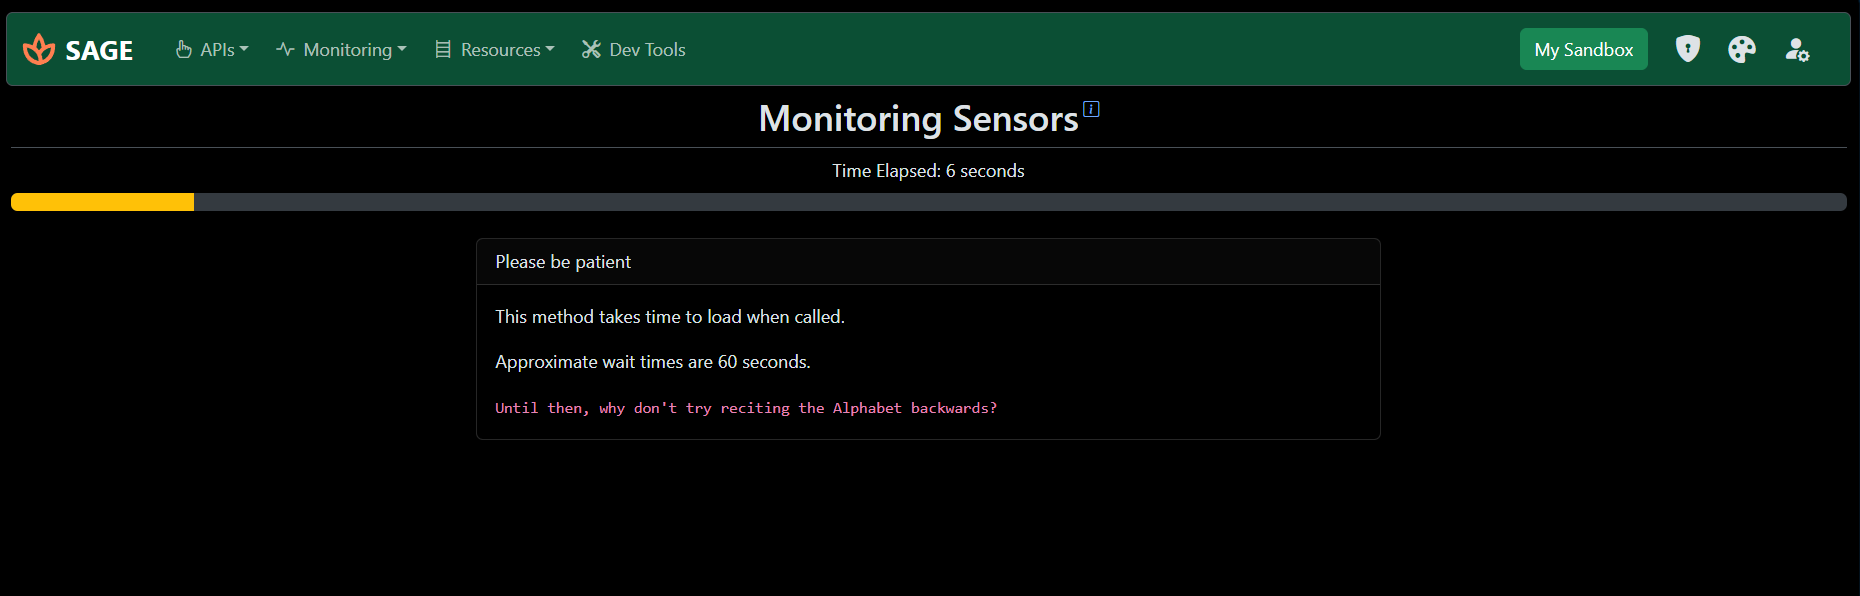
To access the it, navigate to Monitoring > Sensors. Upon loading, SAGE queries the target STEP system. Please note that the initial fetch may take a moment as the server aggregates the sensor data. Subsequent requests are instant due to server-side caching until refreshed by the server (every 5 minutes in my testing).
Interpreting the Data
Sensor data is presented in a responsive layout - as a table on larger screens and as cards on mobile devices. Each entry lists the sensor's name, its current status, and a link to view additional details.
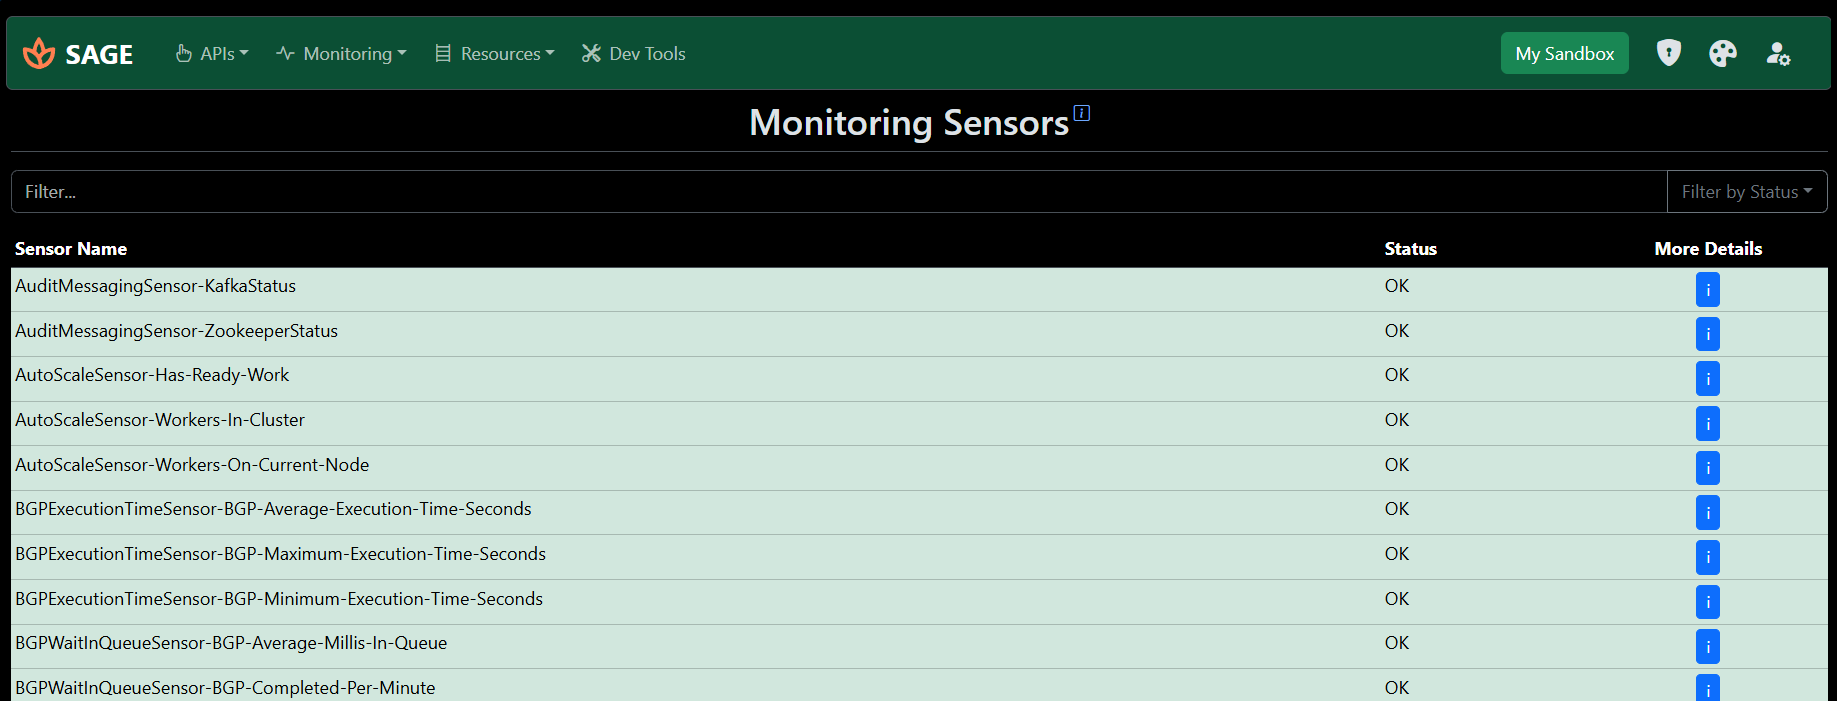
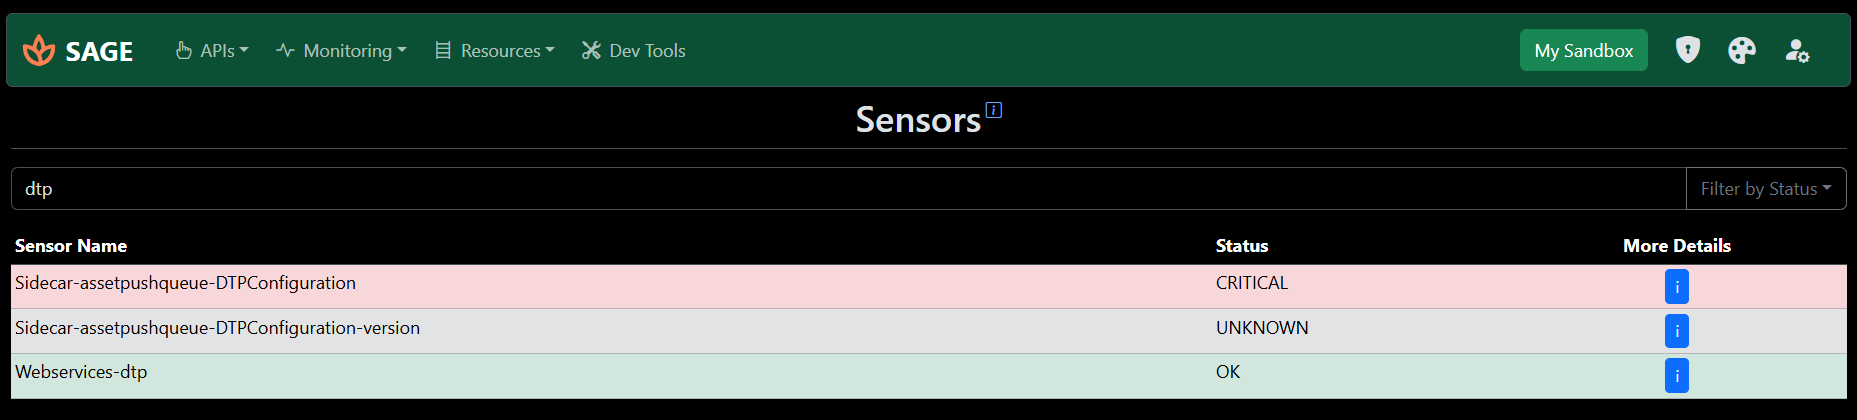
Status indicators are color-coded for immediate visual feedback:
- Green (OK): The component is functioning normally.
- Yellow (WARNING): The component requires attention but is operational.
- Red (CRITICAL): The component has failed or is in a critical state.
You can quickly locate specific sensors using the search bar or filter the list by status using the toolbar controls.
Healthchecks
Healthchecks are diagnostic tests configured within the STEP platform to analyze system configuration, data integrity, and performance metrics. SAGE provides a streamlined interface to view the results of these tests via Monitoring > Healthchecks.
Unlike Sensors, which provide a live status, Healthchecks are typically scheduled tasks or manually triggered reports. SAGE retrieves the history of these reports, allowing you to analyze system health over time.
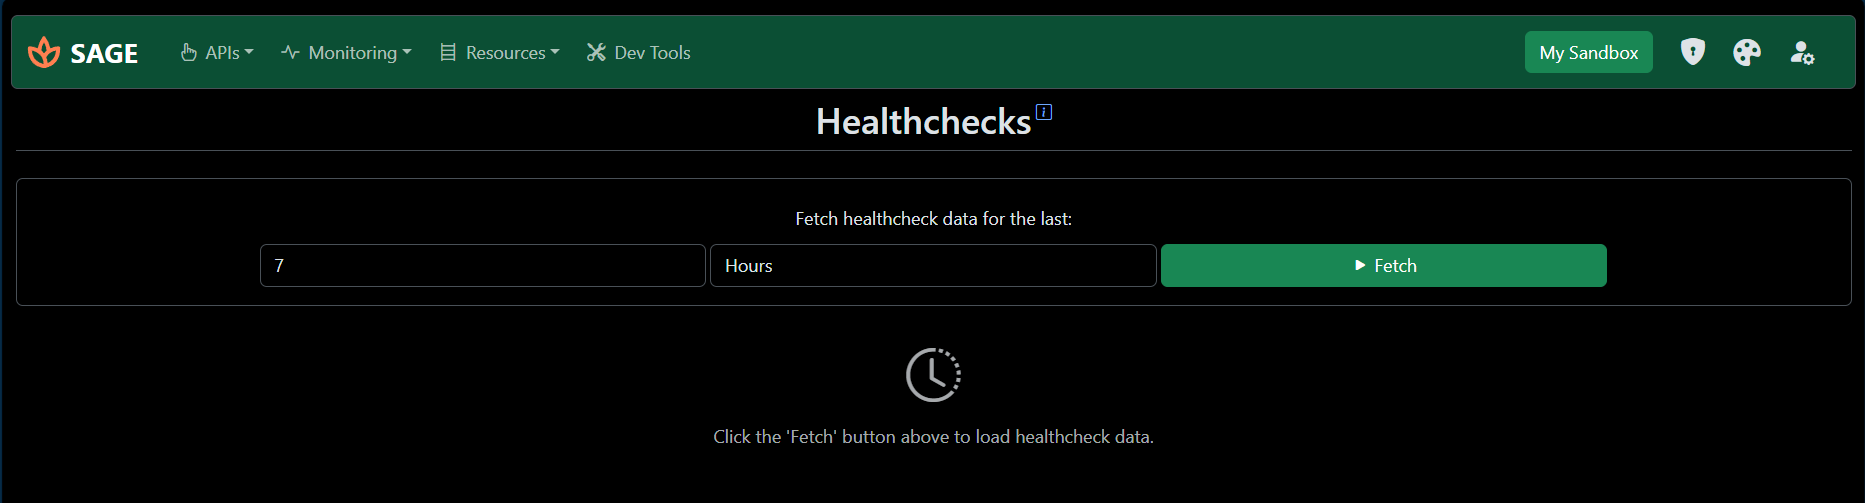
Retrieving Reports
To view Healthcheck data, specify a time window (e.g., the last 24 hours) in the configuration panel. This filters the results to show only reports generated within that timeframe.
Click Fetch to retrieve the data from the STEP system.
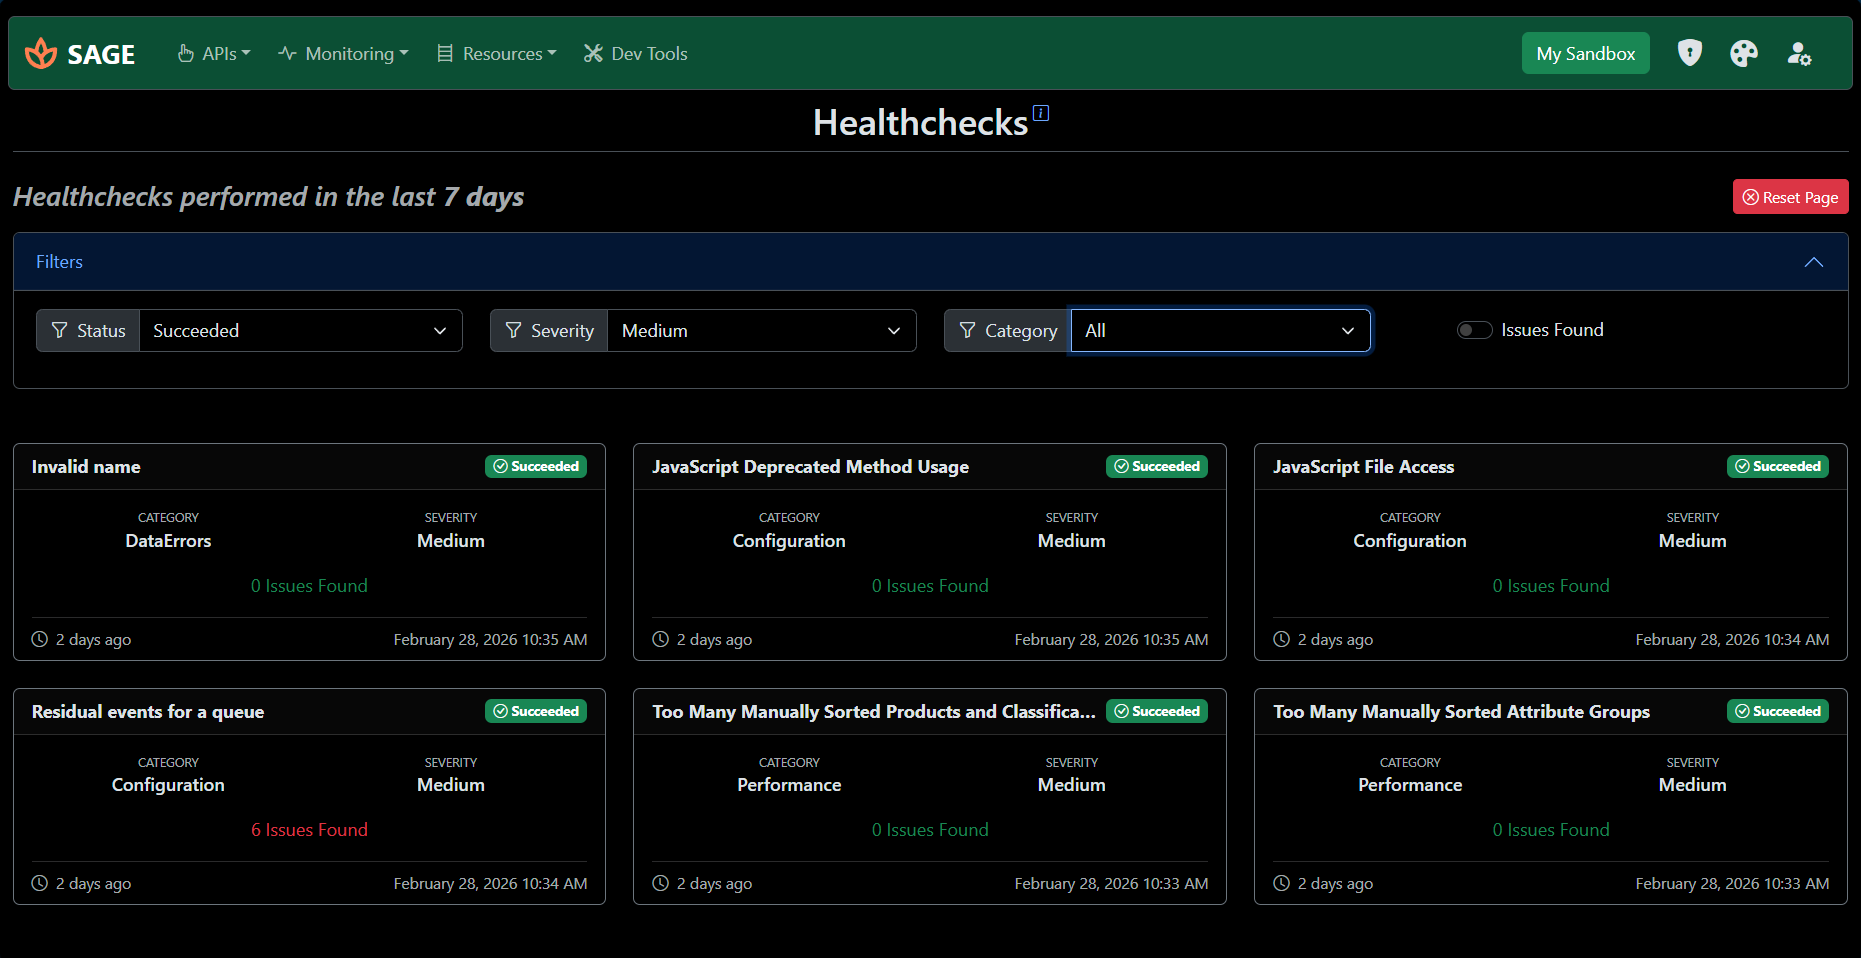
Analyzing Results
Results are displayed as individual cards for each Healthcheck. Each card provides a high-level summary:
- Header: Displays the Healthcheck name and overall status.
- Body: Details the category, severity level, and the number of issues detected.
- Footer: Shows the exact timestamp of when the check was performed.
Use the accordion filters at the top of the page to narrow down results by category or to isolate checks that reported issues.